Stats for Dummies - Episode 3: Advanced Stats
Why are advanced statistics used? What do they have more than the traditional ones?

Welcome back to Stats for Dummies. Let's continue our journey to discover the statistical world applied to basketball. Today we will try to understand why the advanced statistics are proposed so assiduously instead of the traditional ones.
In the first two episodes of "Stats for Dummies", we have built the foundations on which the statistical analyzes are based: we have discovered that there are some control systems, which make possible to check that the analysis in progress is not based on unreliable numbers. The next question is: why are advanced statistics used? What do they have more than the traditional ones? Let's start with some theoretical considerations and then move on to examples.
The statistics are defined as "advanced" because they require mathematical steps to obtain them: these passages turn the basic statistics of players and teams (points, rebounds, assists) into values that are more suitable for a performance evaluation. This is because, as we shall see shortly, various traditional statistics do not actually provide adequate indications for an analysis.
In addition, most of the advanced statistics are based on a specific unit of measure, much more convenient for an analysis: the possession. Normally we deal with statistics "per game": however, each game can be totally different from the previous one. This implies that apparently equal statistics are actually very different from each other. Possession is instead a much shorter event and therefore it is more suitable as a unit of measure of contributions.
The statistical definition of a possession: it is a play that ends in one of the following ways:
- A shot is made (from the field or from the free throw line);
- A defensive rebound is grabbed;
- A ball is lost;
As mentioned in the previous article, an offensive rebound does not generate a new possession but will be part of the one already started. This definition is the base for a multitude of different statistics, which are usually defined as "per 100 possessions". We consider 100 possessions for a simple matter of simplifying the reading: considering a contribution per possession, we would obtain values around the unit. Multiplying by 100 simply improves the reading.
Obviously, not all the statistics are calculated on 100 possessions, but they are computed to give more detailed information. One of the best examples to prove this is the difference between rebounds and Rebound Percentages.
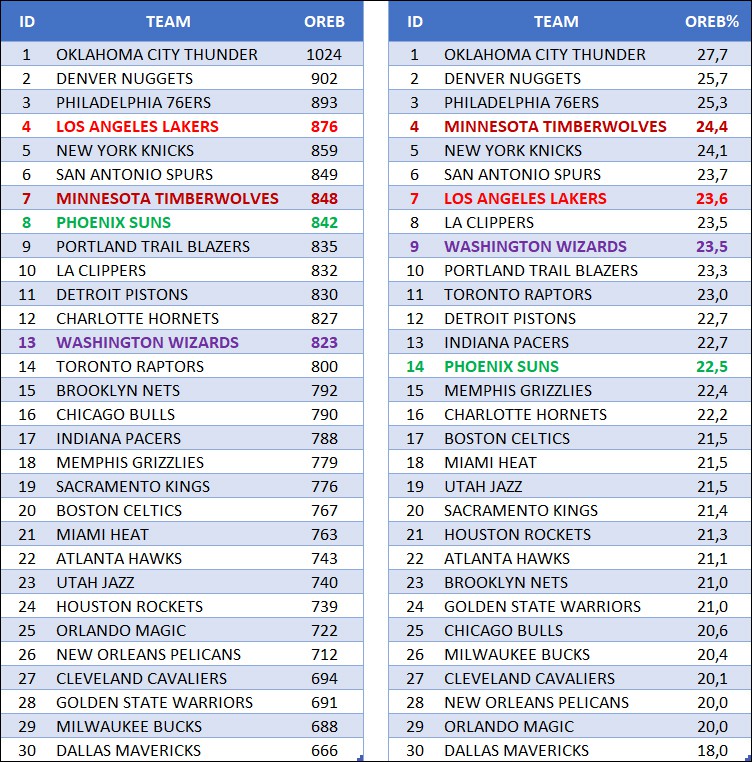
Some paragraph above I was talking about providing adequate indications: what indication does the number of rebounds give us? Are we really interested in knowing the number of rebounds grabbed? Well no or better not in most cases. In fact, when we want to compare the rebound ability of two teams, the simple number of rebounds grabbed by both does not allow us to understand which one is the best. Let’s observe the following table:
On the left, you can find the ranking of the total number of offensive rebounds captured during the regular season, while on the right you can find the advanced statistics related to the same offensive rebounds. The total number of rebounds is only a count and does not make it clear which teams is the best in this technique: because actually, we don't want to know which team has taken the most in absolute terms, but rather in relative terms. The advanced statistics OREB% (offensive rebound percentage) is, in fact, the percentage ratio between the offensive rebounds and the sum of offensive rebounds and opponent defensive rebounds, which allows to immediately understand which are the best teams to get an offensive rebound. The Lakers, for example, are third in the overall ranking, but seventh in the ranking of advanced statistics: if 100 is the total amount of rebounds generated under the opponent's basket, the team of LA captured 20.6% of those rebounds; the rest has turned into a defensive rebound. Minnesota, on the other hand, has captured less in absolute terms, but more in relative terms. Therefore, the TWolfs are better than the Lakers in this aspect of the game.
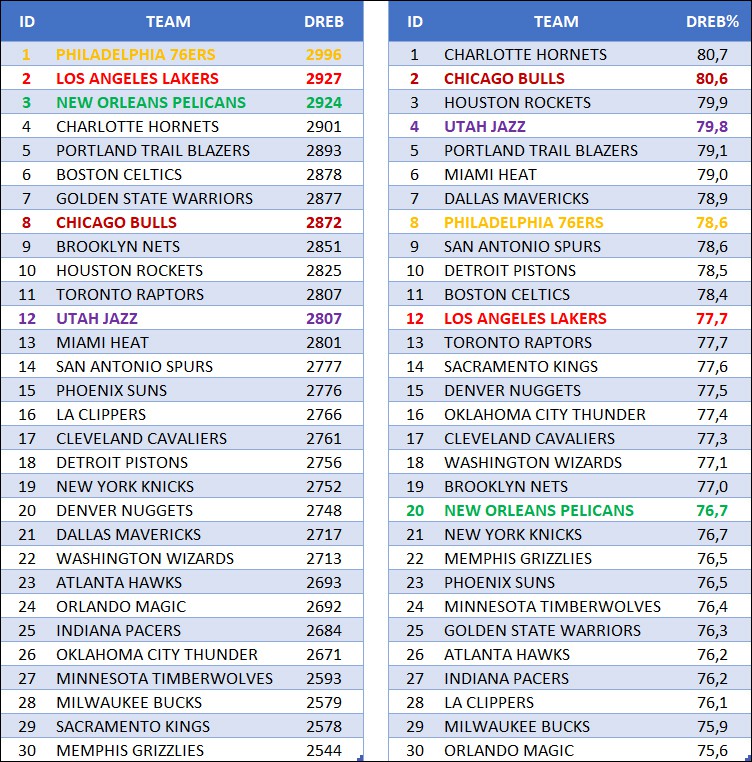
This fact is even more evident in the defensive rebounds:
The first team in terms of absolute numbers is Phila, but actually, the relative number tells us that Phila is not among the best in getting defensive rebounds. New Orleans makes the idea even more clear: it falls down from 3° to 20°.
Getting the rebound advanced stat is a simple calculation (a ratio), but it makes clear the idea behind the calculation of advanced statistics: we are almost never interested in absolute numbers, but rather the relative numbers.
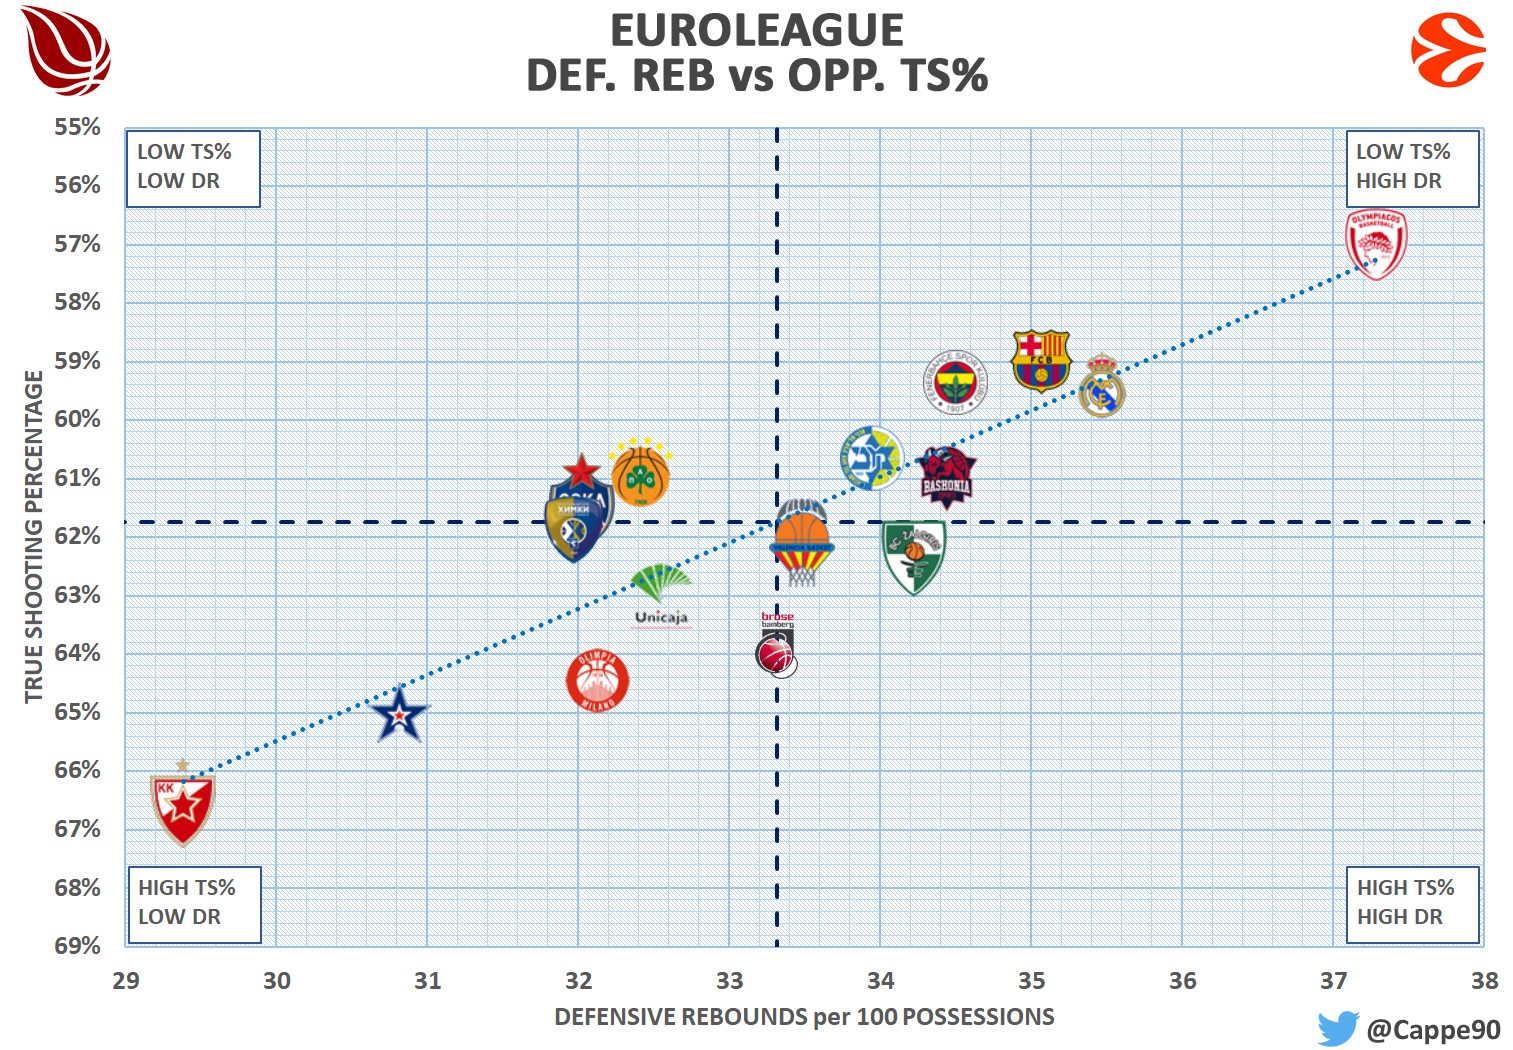
Always about rebounds, I want to show you another lack that the number of captured rebounds hides:
The above chart shows the teams distribution by correlating the defensive rebounds (per 100 possessions in order to delete the Pace differences) with the opponent TS%. What do you notice? Greater is the percentage of shooting, greater is the number of rebounds grabbed. A linear distribution. This is because more are the missed shots, greater will be the defensive rebounds that will be generated. Therefore, reading only the number of rebounds does not allow us to understand which is the team has won most battles under the rim. However, it is immediately clear which team is the best one with advanced statistics:
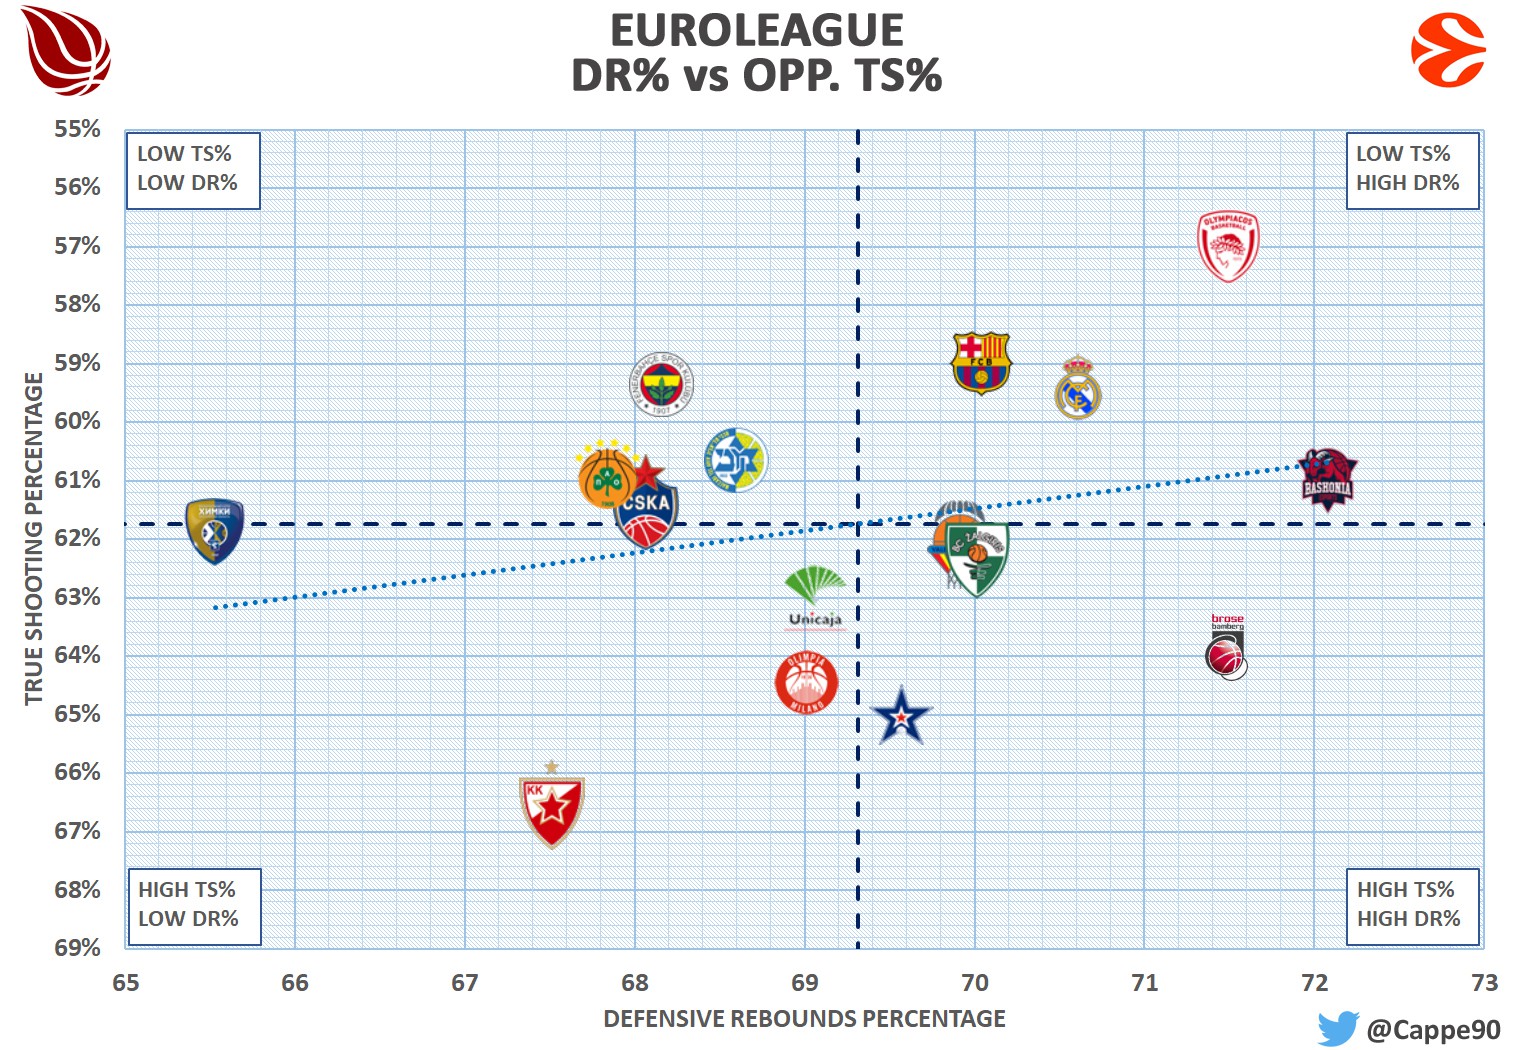
By inserting the Defensive Rebound Percentage on the abscissa, the graph greatly modifies its distribution, moving from homogeneous and linear to completely inhomogeneous. This is because the number of rebounds is strongly correlated to the shooting percentages, while the related advanced statistic is purified by this dependence, making it much more suitable for an analysis. Baskonia is the team that captures more defensive rebounds; this fact was not obvious in the previous graph, where the Spanish team was near the intersection of the two average lines.
These are some examples that show how the advanced statistics, although sometimes appear as abstract numbers, are more effective and appropriate for a correct analysis. Thanks to the calculations behind them, they are cleaned of defects that the normal statistics present. In the next episodes, we will explore other differences between classical and advanced, in order to cover slowly all the aspects of the game.
Article by Luca Cappelletti


 You must be registered to post a comment