


Stats for Dummies - Episodio 2: Blackjack
What is the purpose of statistics applied to basketball? Well, it is not to predict, but to understand more accurately what has happened on the court

Welcome back to Stats for Dummies! After the first chapter dedicated to the average, in this new episode, we will try to disperse some convictions of the most bitter detractors of numbers with the help of a comparison.
Who has watched the movie 21?
“Winner, winner, chicken dinner!”
This was the motto of the guys who were going to hit the jackpot in Las Vegas thanks to the card counting in the game of Blackjack. This count is nothing but a method to estimate the winning chances of the player against the dealer. In other words, by assigning a specific value to each card, it is possible to determine the right moment to make the riskiest bets.
Therefore, card counting is a predictive statistical method: with this is possible to estimate with enough accuracy whether the next card drawn from the deck will be high or low and, based on that guess, decide if bet and how much.
This idea that statistics can always predict the future is quite widespread; actually, in basketball as well as in other things, statistic is not predictive. That's because there is a huge difference between basketball and blackjack: the number of possibilities.
Card counting is possible because the composition of the deck is known and after each drawn card you can estimate the chance of which card will come out later.
Quick example. From the classic deck of 52 cards (containing 40 numbers and 12 figures) the first 42 cards are drawn: 39 are numerical cards and 3 are figures. It is clear that the next extracted card will have a very high chance of being a figure, because we know that the remain cards are one number card and nine figures.
On the other hand, basketball does not work like this: it's like having a deck with endless cards. It is not possible to predict which card will be drawn because the remaining components of the deck are unknown. In other words, every movement in basketball is an aleatory (or stochastic) phenomenon: it means that the results of those movements cannot be determined with absolute certainty because there are not enough data to run a exact calculation. The act of shooting is different every time, as far as one can train himself: a slightly different jump, a different position of the finger, the presence of the defender are all unavailable data for a predictive analysis. This fact can be extended to every movement in basketball, thus making the whole game an aleatory phenomenon.
Now the question could be: ok so then, what is the purpose of statistics applied to basketball? Well, it is not to predict, but to understand more accurately what has happened on the court. This is the real use of statistics in basketball.
Converting contributions and situations into numbers, helps understanding the game, allowing us to categorize and classify every aspect. In this way, it is easier to recognize the trends of an opponent team and try to limit it. Or, again, improve the contribution of players to increase their efficiency.
Let's see two examples: last year Zalgiris in the regular season of Euroleague was one of the tough teams to challenge. Let's take a look at the following statistics in order to find a possible weak point to attack: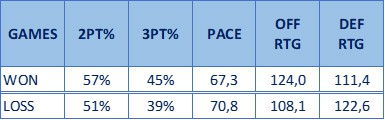
We can observe that in the won games the Lithuanian team shot very well, but in particular they were very good in 3-point shots. Therefore, a good defensive adjustment would have been to limit Zalgiris shooters. But this perhaps, even without statistics was easily understood. In fact, Pace matter is more interesting: we can observe that the pace in the victories was low, while in the lost games were above the league average (69.5). Knowing that, it would have been useful trying to raise the pace, in order to bait Pangos and mates to run more; ratings show that at a high pace the Kaunas team came out of their comfort zone, losing their offensive efficiency and suffering much more in defense. This particular aspect can be only found out with stats analytics.
This banal example helps to understand how the statistics are not used to predict how the Zalgiris will play the next game, but rather as an analysis tool on the games already played.
Another example: Olimpia Milano has one of the best catch and shoot specialist in Europe, Dairis Bertans. Through the available data it is possible to compose his Shots Chart, which I report below (thank @lostgps for the superb job):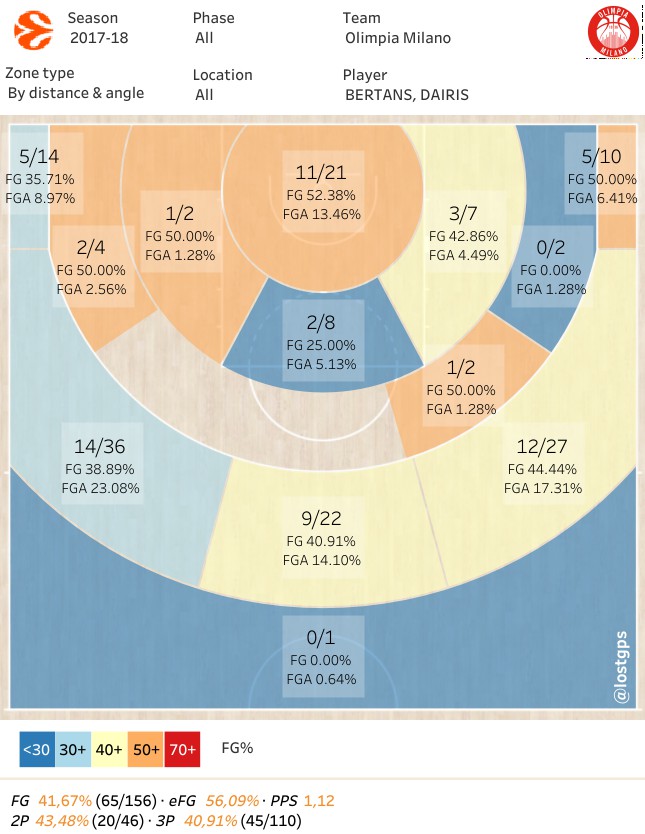
Observing the graph, it is possible to notice that Bertans have shot slightly better from the right side than the left side. In fact, the overall percentage is 38% on the left side, while it is 46% on the opposite side. The coaching staff could think to create some plays that bring the Latvian more on the right, in order to have more chance to made a three.
Using these new plays does not mean that Bertans will automatically improve his shooting percentages. The statistics are not used to predict a better percentage of the Latvian, but rather to find a possible trend that could guarantee benefits to both the player and the team. To find out if it will work or not, they have to wait next games and then analyze the new data.
These two examples are quite simple, but they are useful to understand the most appropriate use of the statistics applied to basketball: thanks to them it is possible to identify aspects of the game with more precision with the final goal of the improvement. Basketball cannot be predicted (and this is its beauty) because it is a set of infinite aleatory phenomenon.
Article by Luca Cappelletti

Sportando
@Sportando You must be registered to post a comment