


Stats for Dummies - Episode 1: The Average
Stats for dummies will try to explain everything behind stats and their use in basketball, in order to defog the skepticism about them. In the end, statistics are nothing more than items and so they can be used well or badly

Statistics have always been part of basketball. Points, rebounds, assists and many other efforts have always been noted during matches, some for the normal flow of the game (points, fouls), others to define the contribution of the players for the team (assists, blocks).
In recent years advanced statistics came out: those allow having a clearer view of games, teams and players. Part of basketball lovers, however, seems to be skeptical about them.
Stats for dummies will try to explain everything behind stats and their use in basketball, in order to defog the skepticism about them. In the end, statistics are nothing more than items and so they can be used well or badly. It’s up to the analyst to use them correctly.
In this first episode, we start from a basic concept, but very important to understand statistics: the average.
We all use averages, in basketball as well as at work. However, it often happens to run into gross errors. Let's start with the definition of average by Wikipedia:
“Average is a middle or typical number of a list of numbers”
In other words, through the average we summarize a set of data into a single value. Rather than listing the points scored in each game by a player, thanks to average we can concentrate that list into a single digit. All this is convenient, but hides some pitfalls.
In fact, almost unconsciously, every time we read an average we look at the number of games played. Why? The reason is easy to understand: average does not allow us to have a clear idea of how that player or team got that number.
Let's see an example: during last season, Khris Middleton averaged 20.1 points per game. Marshon Brooks has gotten the same value. It is clear that the first thing to do is check the number of games played: 82 for the player of Milwaukee, 7 for the former Olimpia Milano. A big difference and we don’t even consider that Brooks has played only garbage games.
This aspect of the games played is not verifiable by reading the average alone: the points scored in each game by the two Americans lead to the same average points, but they got it with different paths. It is common to hear that numbers never lie: this is a clear example. The two averages are not lying, it is up to the reader to understand that Brooks probably would not be able to guarantee that contribution of points to the team if he played as much as Middleton. Sometimes this is not taking into account: we compare players' averages with very different number of games played (or minutes played), equalizing not equivalent efforts. In other word, it’s important to know the "history" of an average.
The control of the sample is a basic tool in statistics: an average calculated on a small sample is not so reliable.
Another basic tool in statistics is standard deviation: thanks to it, we can obtain information that the average alone does not give.
Let's see a new example: in the last regular season Atlanta, Orlando and Miami had the same points per game, 103.4. In this case, the sample is the same for all teams (82 games played). Even if the averages are calculated on equal samples, they do not allow us to understand how the three teams have reached that value. To get more information we could compare the points scored in each game: 82 values for 3 teams are almost 250 numbers to compare. Definitely too many, but the standard deviation comes to help us. This tool allows us to know the average deviation between the single value and the average. The graph below will help you to better understand: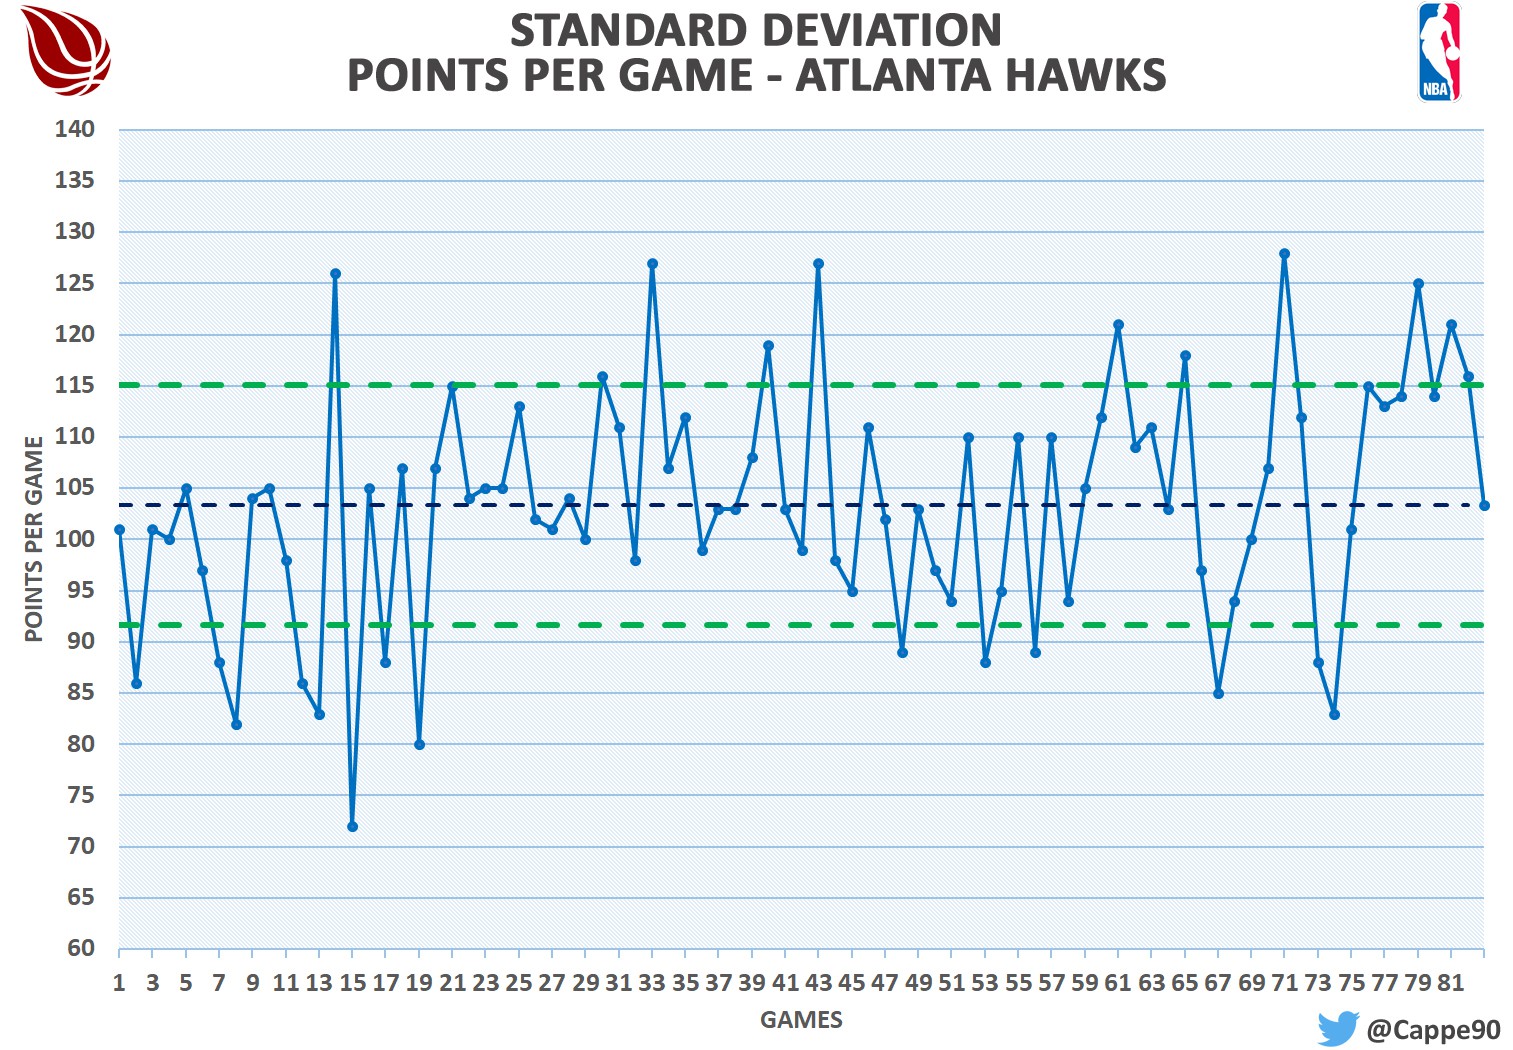
The blue line shows the trend of points per game of Atlanta; the dark blue dashed line is instead the average. The two green dashed lines are distant from the average by the same measure: this measure is the standard deviation. Most of the results obtained from Atlanta are within that area. In other words, during the regular season the Hawks were very likely to score between 92 and 115 points. Miami has the same oscillation of Atlanta, while the one of Orlando varies between 94 and 113. Yes, these are minimal differences, but you can still imagine the importance of the standard deviation: if we read the average alone, we could not understand that Orlando is the most constant among the three to score 103.4 points per game.
In Europe the standard deviation is a tool that has even more relevance than theUS, because of the average number of games played here, that is much lower than NBA; usually we play about 30 games, instead of 82.
As we discovered earlier, an average based on a little sample is not reliable. But why? Because the “anomalous" values (numbers much higher or lower than the others that make up the sample) influence much more the average based on a little sample. Quick example to make the idea: a player always scores 20 points, but he scores 50 in a game. In case he played ten games, the overall average will be 23, while if he plays 40 games the average will be 20.8. That single 50-points match influences more the first sample than the second one.
Therefore, when we are dealing with little samples (like in the European leagues) the standard deviation allows us to better understand the story of averages.
Another example: Gudaitis of Milano and Kennedy of Pistoia averaged the same points per game last season, 10.9. These two averages have been created from very different performances. In the eight games played by Kennedy, there is one performance of 26 points: this game brings the average from 8.7 to 10.9. In terms of standard deviation, Arturas has a SD of 5, while the Pistoia forward 6,3. Thanks to the standard deviation we immediately understand that the big guy from Lithuania was more constant than Kennedy, while the second has taken benefits from a single game to get a higher average.
Of course, we don’t need to calculate the standard deviation every time we study some stats: the purpose of this first chapter of "Stats for dummies" would be rather to show how two apparently equal numbers can actually be different.
It is always useful for looking for the number of game played (and, if necessary, the standard deviation), in order to avoid some mistakes that can lead to incorrect and misleading analysis.
Article by Luca Cappelletti

Sportando
@Sportando You must be registered to post a comment