


The influence between offensive rebounds and offensive efficiency in Lega Basket Serie A
Do the offensive rebounds affect the offensive performance of a team? And can this influence be found out from the numbers? The answer is: probably yes, but probably there could be also some exceptions among the 16 teams

We are happy to announce the addition to Sportando of Luca "Cappe" Cappelletti who will write for us for the entire season about "stats analysis".
During this season he will provide analysis with the support of numbers and charts.
In these first weeks we will publish some data of the last season starting from Serie A.
Let's start with a question: do the offensive rebounds affect the offensive performance of a team? And can this influence be found out from the numbers?
The answer is: probably yes, but probably there could be also some exceptions among the 16 teams. Let’s find out the reasons behind these exceptions.
I have intersected two data as simple as useful in this analysis: the Offensive Rebound Percentage and the Offensive Rating. For whom doesn’t know advanced stats, I give you a link to my blog, where you can find a glossary, calculation explanations and more else. 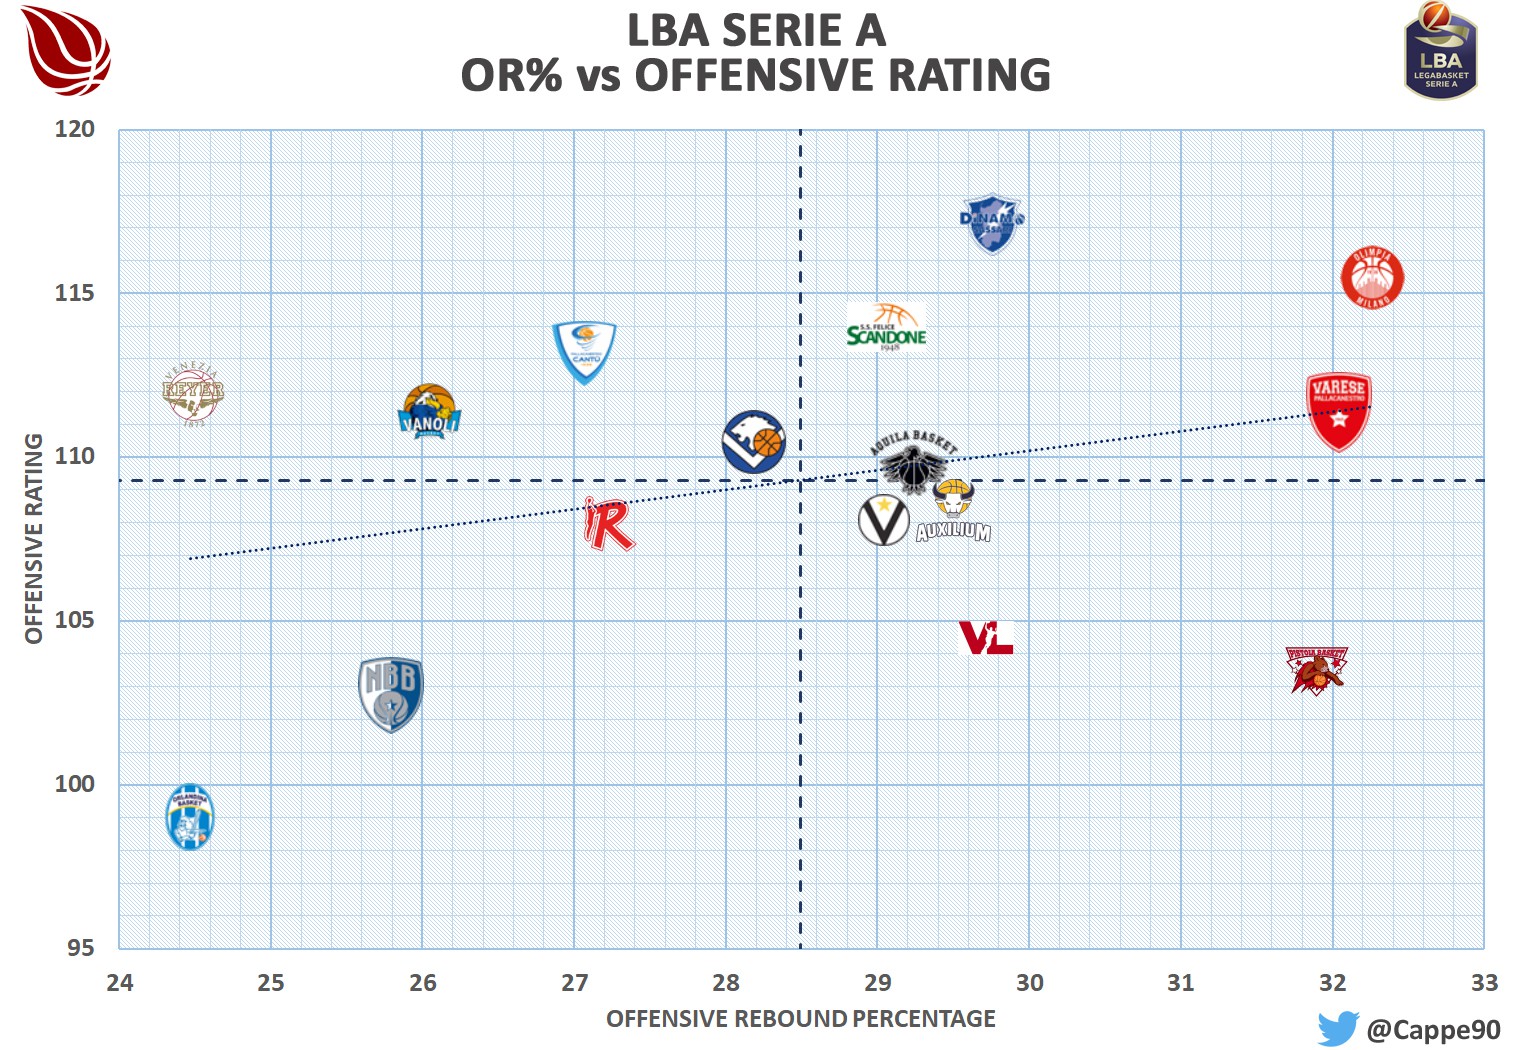
Some hints on how I generally create the graphs:
- On the abscissa and ordinate you can find the two data in analysis. The scatter plot is the best to display two data at the same time; furthermore, if there is a tendency, it will immediately be highlighted;
- The two blue dashed lines are the averages of the two data: they divide the graph into four quadrants. The quadrants help to better understand the disposition of the data. Usually the top right quadrant is the one with the best statistics. So, teams or players inside it are the best for that specific analysis;
- The blue dotted line is the trend of the chart. We will have the opportunity to better understand this aspect later, but for now it is enough to know that this line shows the type of diffusion of the points of the graph. Its inclination will allow us to understand whether or not there is a trend and whether it is positive or negative;
In the specific case, we notice that the trend line is inclined upwards: this means that there is a correlation between the two data, as we have expected. Greater is the quantity of offensive rebounds grabbed, better is the Offensive Rating of the team. Teams like Olimpia Milano or Dinamo Sassari show that when you get a second opportunity, you get a higher chance to score (and so to have a higher Off Rtg). Capo d'Orlando and Brindisi, on the other hand, show the inverse and in fact they are in the opposite quadrant of Milan and Sassari. For the other teams: moving from left to right, we find the teams higher and higher, confirming that the trend is real.
As we said in the incipit, there are exceptions: in this case we see that Venice, even if it has one of the highest offensive rating in Serie A, has one of the lowest OR% too. Pistoia is in the opposite situation: very high offensive rebound percentage, but medium-low offensive rating. Is it possible to find out an explanation for this?
Well, yes: first of all even if there are correlations between two data (like in this analysis), it doesn't mean that for each team that correlation is equally important. There may be teams that focus more on one particular aspect than another and therefore the correlation can be more or less strong.
Furthermore, it must always be remembered that there are also all the other aspects of the game that influence the two data.
Remembering that the offensive rebound is highly influenced by shooting performance, let’s observe the following graph: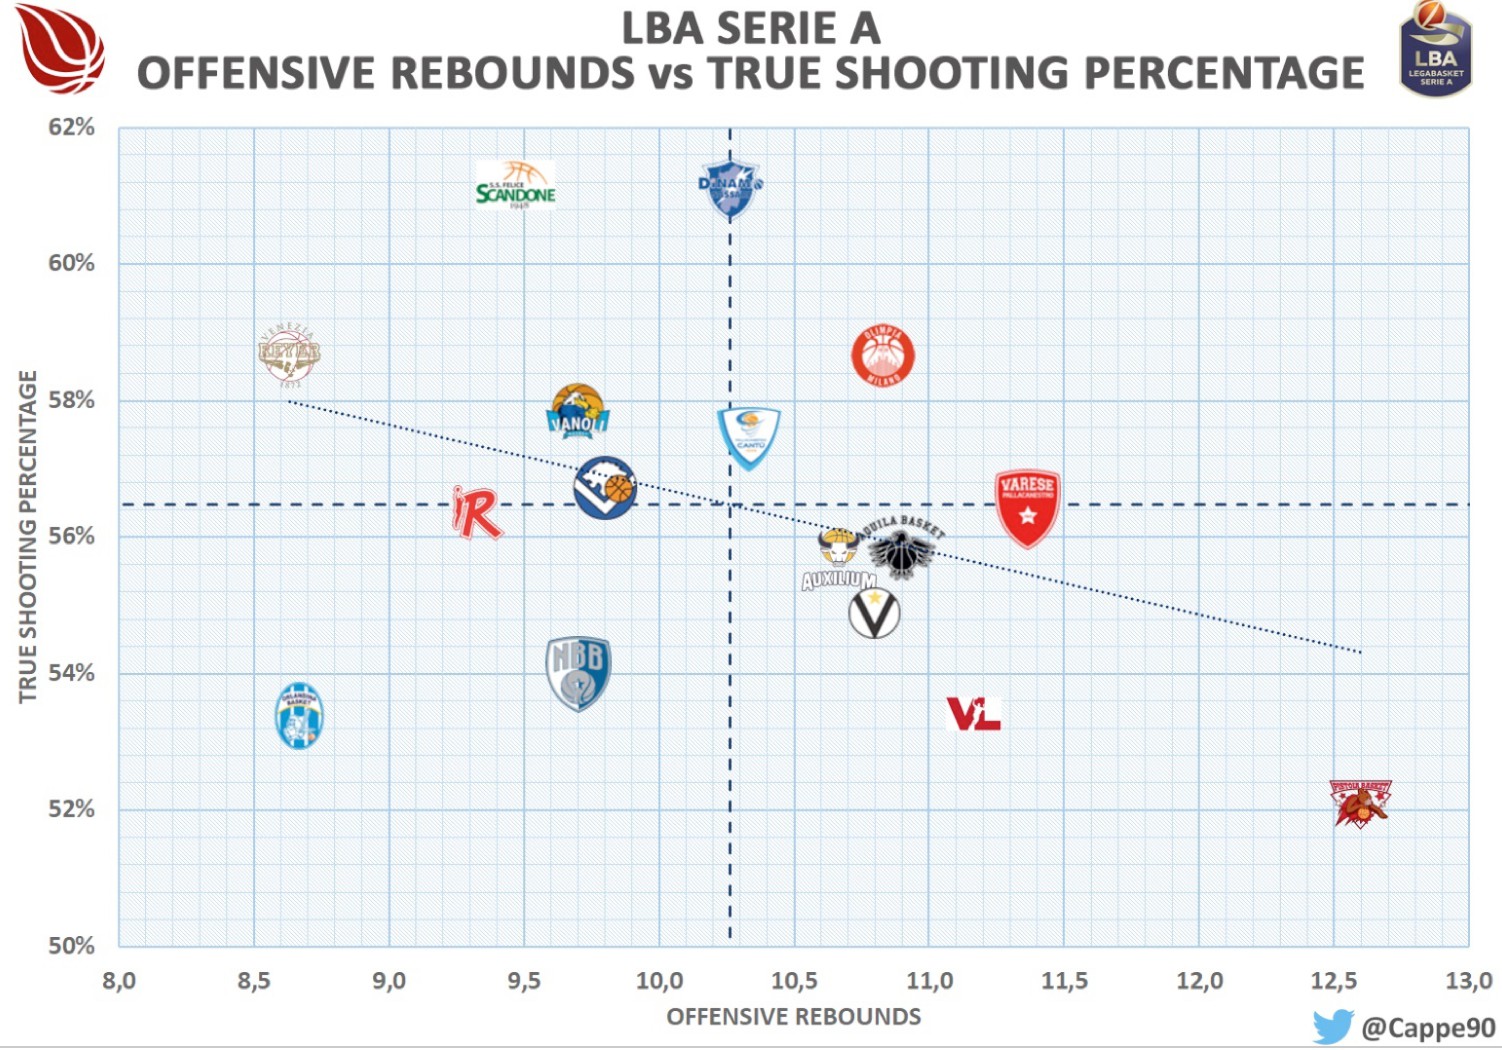
In this second chart I used the offensive rebounds grabbed per game and the true shooting percentage. Which teams are in the corners of the graph? Again, Venice and Pistoia.
When a team shoots well, it produces fewer opportunities for a rebound than another team that shoots bad. Quick example: two teams take 10 shots each. The first one made 7, the second only 4. Three offensive rebound opportunities have been created for the first team; instead for the second team there are six opportunities.
During the season Pistoia has shot badly, but thanks to players like Ivanov, Bond and Gaspardo a good part of those mistakes has turned into a second chance of score. Reyer, on the other hand, having fewer chances, has fewer rebounds.
Is it possible to reduce everything to just a real percentage matter or is there something else?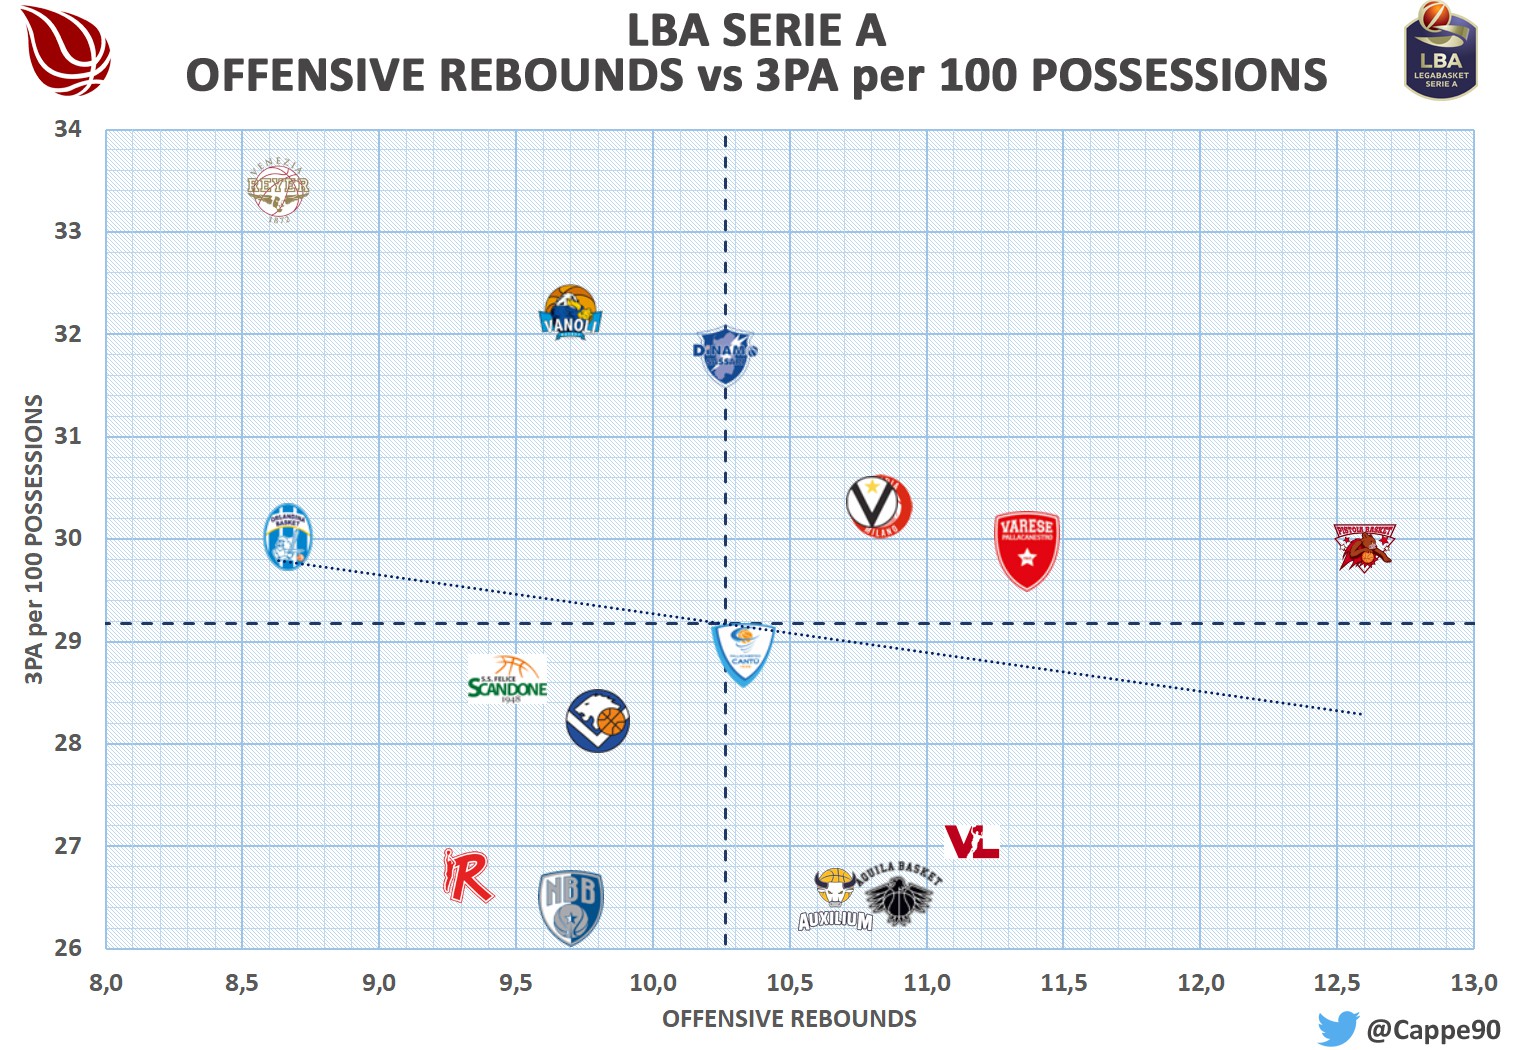
Another aspect that influences rebounds is the position of the players on the court. A team that shoots a lot of 3P will usually have more players on the perimeter than near the rim. Venezia was the highest user of the 3-point shots last season (as shown in the graph above) with almost 34 attempts per 100 possessions. In this situation most of the players are usually far from the rim, so that it is difficult for them to get an offensive rebound.
In conclusion, we can say that, although there is an influence between offensive rebounds and offensive efficiency, this influence is still affected by other factors. In the case of Venice, the good shooting performance and the disposition of the players on the court led to fewer battles for offensive rebounds; for Pistoia, many mistakes generated more rebound opportunities, leading to a high OR%, thanks to good rebounders on the roster too. At the same time anyway, the Offensive Rating has been decreased by those mistakes.
Article by Luca Cappelletti

Sportando
@Sportando You must be registered to post a comment