EuroLeague Evolution of Pace and Possessions Distribution through seasons
Pace is a statistic that is as simple as important: it is the value that allows us to understand the average speed of a team or a league

Last week we talked about Serie A; well, today we talk about Euroleague. More specifically, we will explore the evolution of Pace and the possessions distribution in the last seasons.
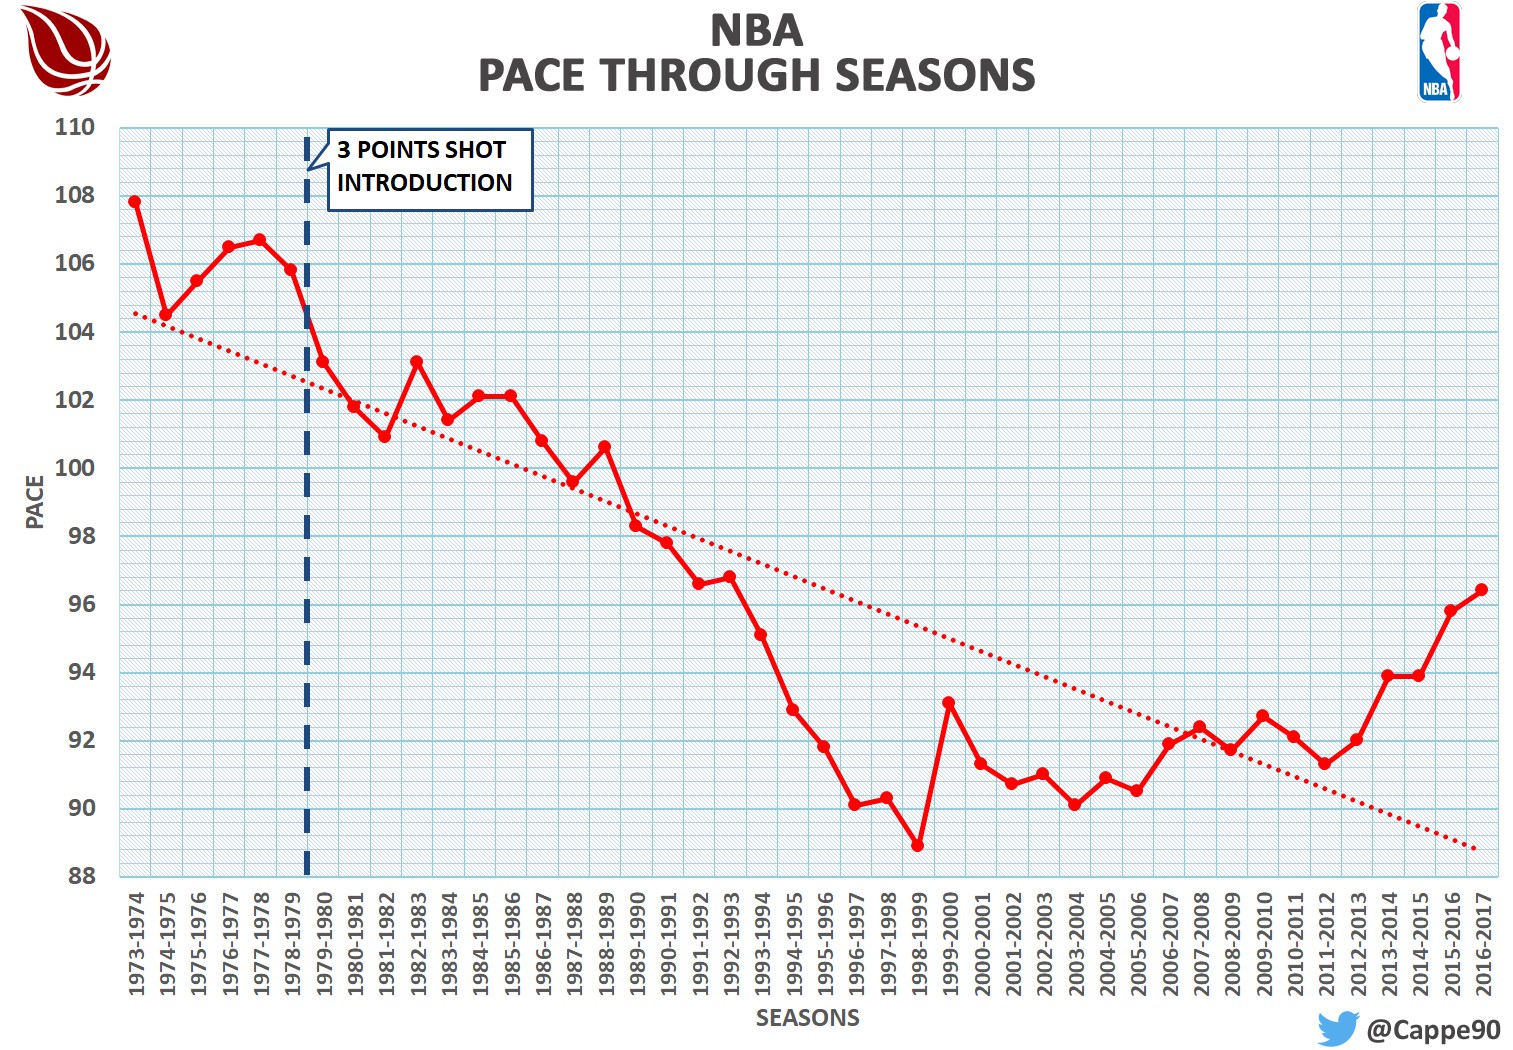
Pace is a statistic that is as simple as important: it is the value that allows us to understand the average speed of a team or a league. Knowing it, it is easier to get an idea of the game you are watching or analyzing. Today we have the perception that current matches are played at a higher speed than in the past: actually, it is the opposite. Using NBA stats (available since the '70s), we note that once the pace was much higher than now. Pace has dropped slowly, probably due to the more available information on teams and players. That allowed to better train the defenses, forcing opponents to longer attacks. The graph below summarizes this situation:
However, In the last ten years there has been a trend inversion: after Pace settled around the 90 possessions per game, it has started to rise again. Basically, it can be said that now they play at a higher speed than the 1990s.
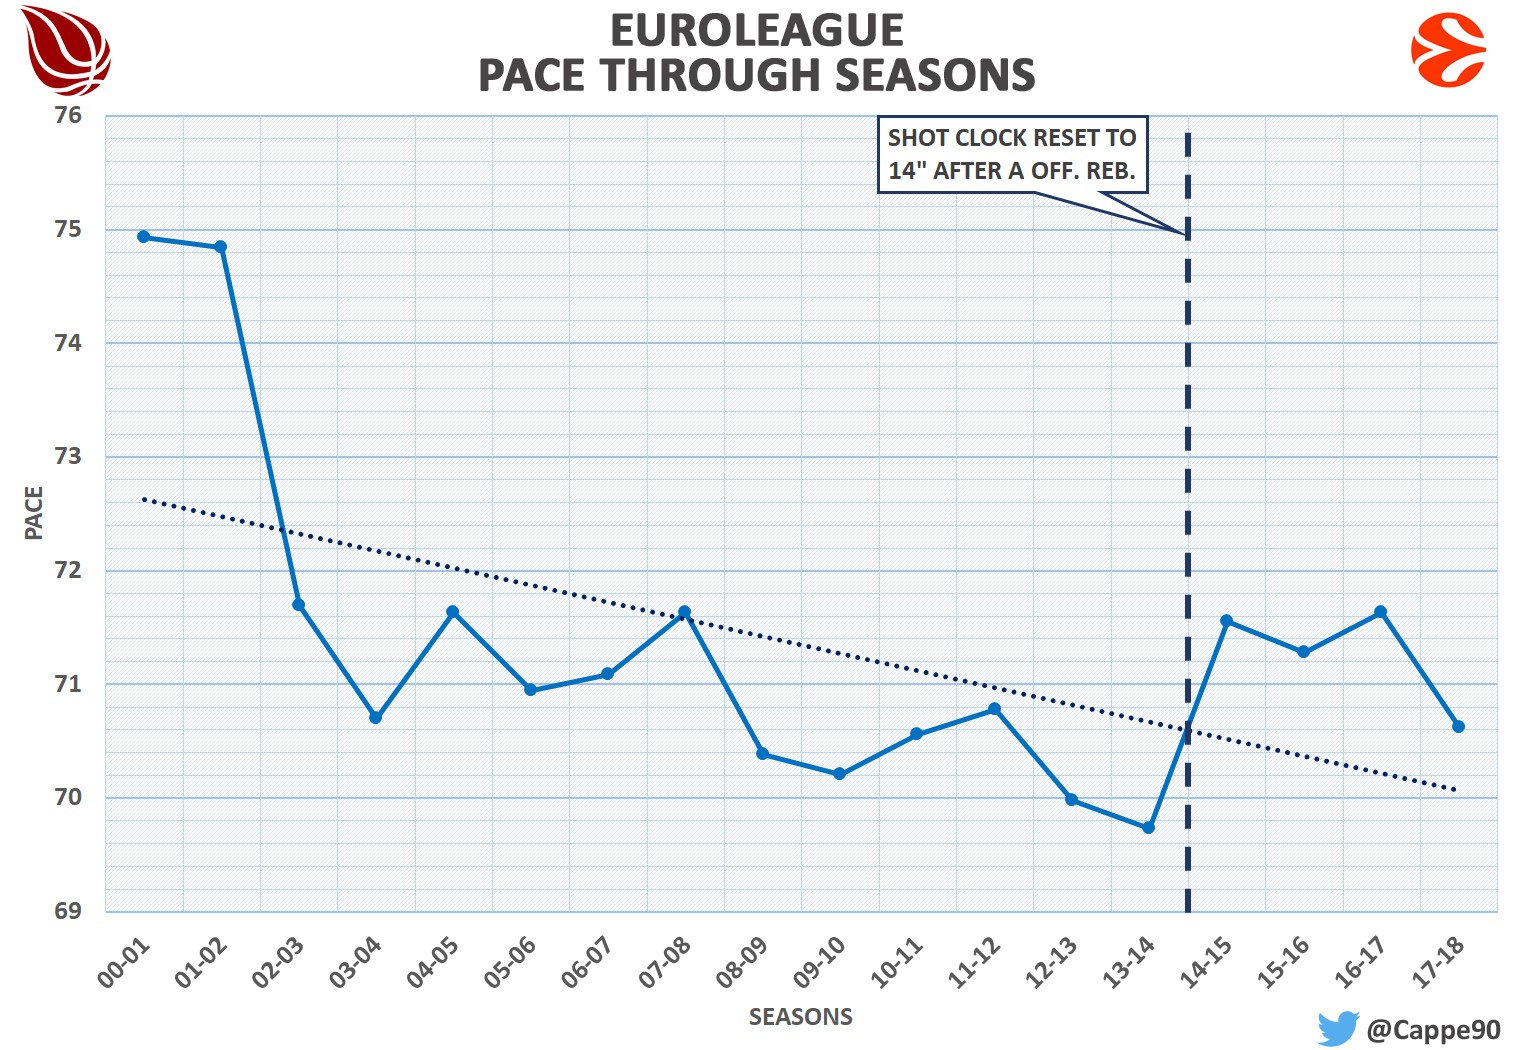
This introduction was necessary due to the fewer available data of the Euroleague; now that we know the global trend, let’s take a look at the next graph:
The available data start from the 2000-2001 season: if the trend began to change in the USA in that season, the decrease was still going on in Europe. In fact, we can see that in the following seasons there has been a gradual decrease of Pace until reaching the historical minimum in the 2013-2014 season, where it had fallen under 70 possessions per game.
However, thanks to the introduction of the shot clock reset to 14” after an offensive rebound, Pace has risen and has settled around 71-72 possessions per game. This rule change has affected a lot, leading to a higher average pace through last seasons.
So, the next question is: how were the possessions played?
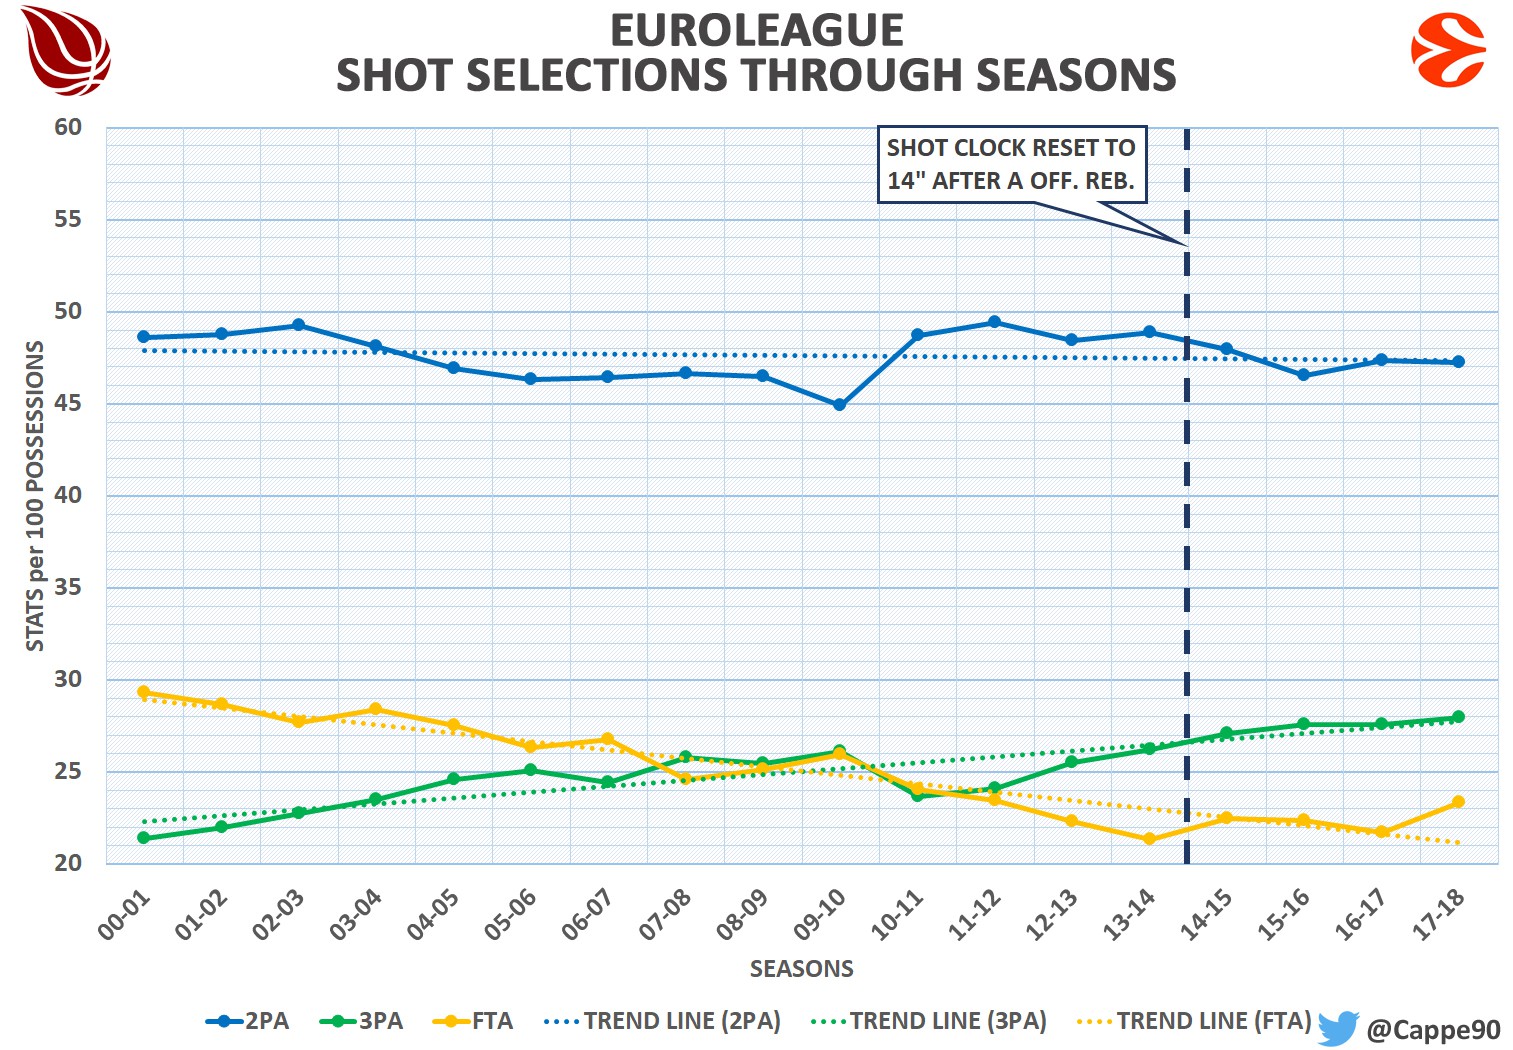
The above graph shows the shots distribution per 100 possessions in last few years. As you can see, the 2P shot has not changed. The real revolution is the number of shots taken behind the three-point line. Until the 2007/2008 season, the number of 3PA was lower than free throws attempted, but from the following season, there has been a trend variation. In the 2011/2012 season there is the final change: from that season the shots behind the 3-point line were higher than both free throws and 3PA of previous seasons. During these years the distribution between 3-point shots and free throws has been reversed. Probably the higher search for a 3-point shot has led to a slower pace, which only the introduction of the 14 seconds rule has stopped it.
A possession, however, does not end only with shooting, but also with a turnover.
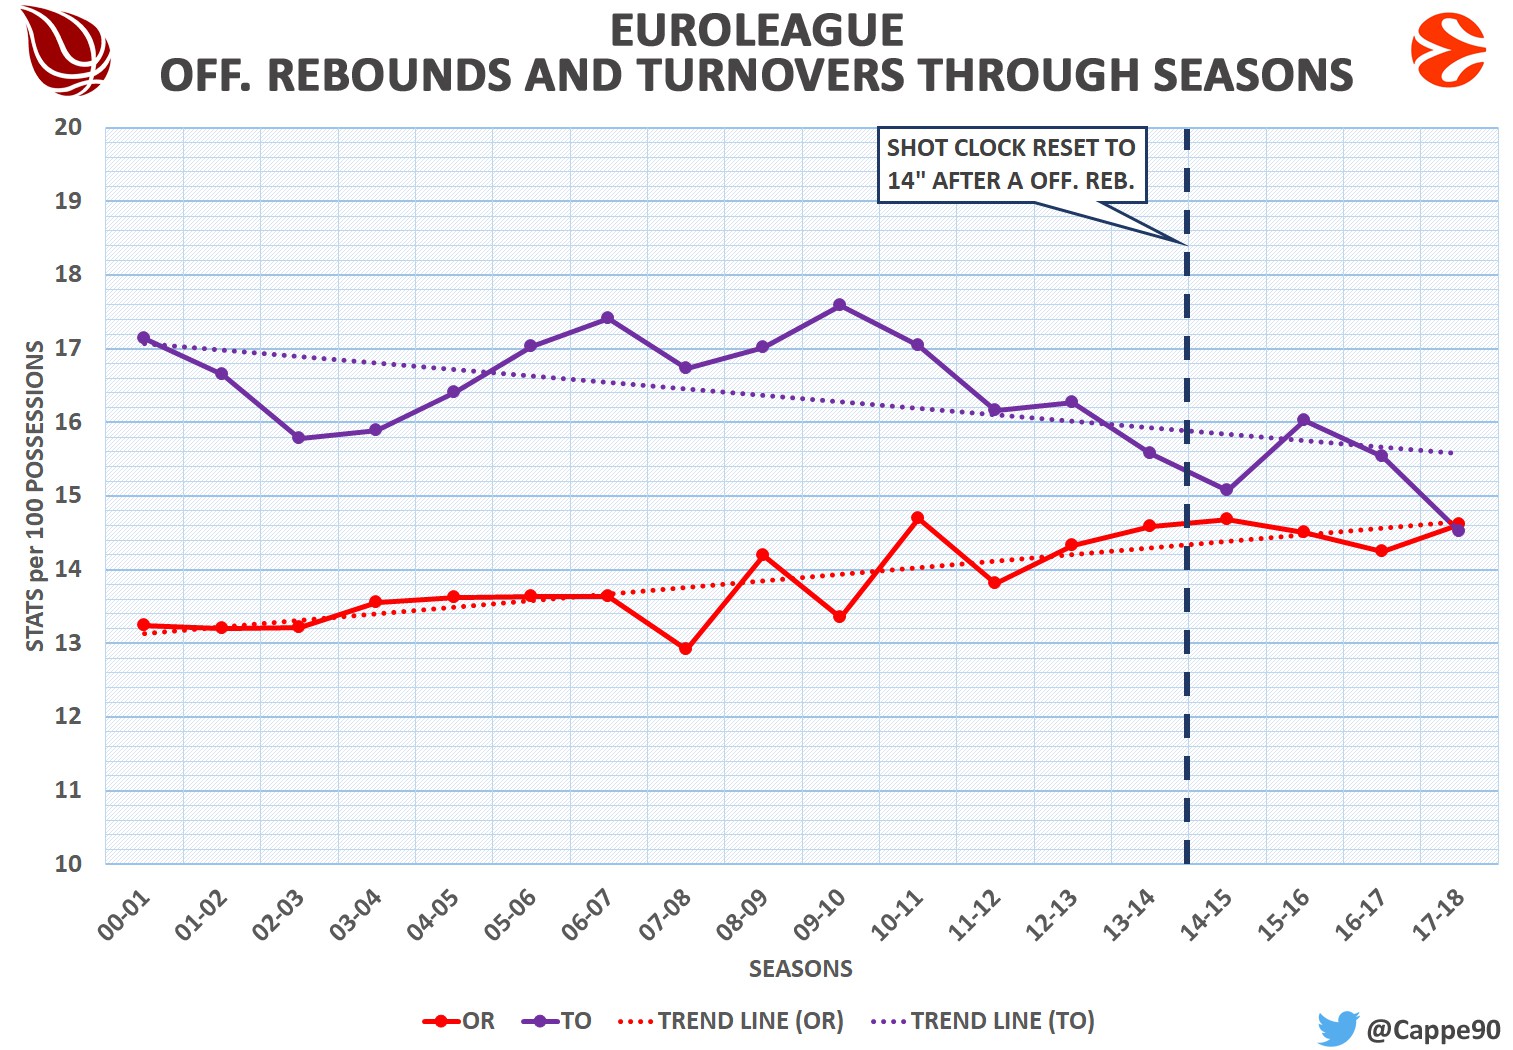
In the last graph we can observe the trend of offensive rebounds and turnovers per 100 possessions. For the first one we note a slow, but constant increase, while for the second one is the opposite. It is partly possible to refer these two trends to the previous graph: most free throws are obtained near the rim, with a penetration or a pass in the low-post. As we have seen, the number of free throws has decreased due to a greater search for the 3-point shot. Therefore, we can hypothesize that the greater use of shooting behind the 3-point line involves less risk in terms of turnover; moreover, it is not uncommon that a missed 3-point shot turns into a long rebound and, consequently, in a more easier offensive rebound to grab.
These are in my opinion the most important reasons behind these changes. Surely there are other factors that have led to these mutations, but they will probably be the subject of other analysis.
Article by Luca Cappelletti


 You must be registered to post a comment